Wednesday, June 21, 2017

Fault anatomy

Fault anatomy

Faults drawn on seismic or geologic sections are usually portrayed as single lines of even thickness. In detail, however, faults are rarely simple surfaces or zones of constant thickness. In fact, most faults are complex structures consisting of a number of structural elements that may be hard to predict. Because of the variations in expression along, as well as between, faults, it is not easy to come up with a simple and general description of a fault. In most cases it makes sense to distinguish between the central fault core or slip surface and the surrounding volume of brittlely deformed wallrock known as the fault damage zone, as illustrated in Figure 8.10.
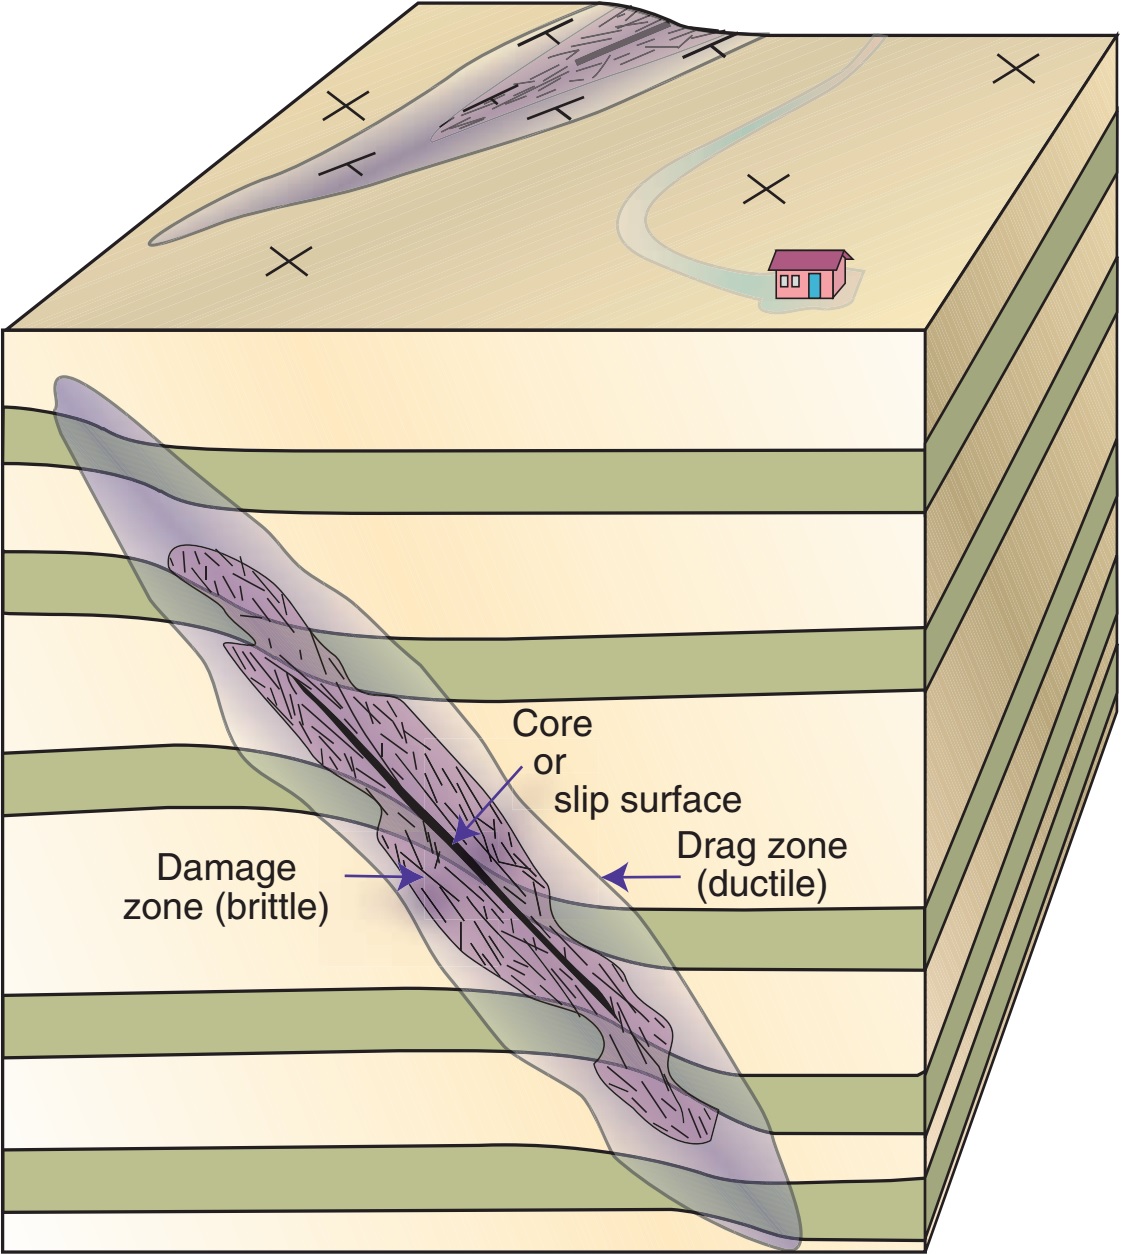
Simplified anatomy of fault.
The fault core can vary from a simple slip surface with a less than millimeter-thick cataclastic zone through a zone of several slip surfaces to an intensely sheared zone up to several meters wide where only remnants of the primary rock structures are preserved. In crystalline rocks, the fault core can consist of practically non-cohesive fault gouge, where clay minerals have formed at the expense of feldspar and other primary minerals. In other cases, hard and flinty cataclasites constitute the fault core, particularly for faults formed in the lower part of the brittle upper crust. Various types of breccias, cohesive or non-cohesive, are also found in fault cores. In extreme cases, friction causes crystalline rocks to melt locally and temporarily, creating a glassy fault rock known as pseudotachylyte. The classification of fault rocks is shown in heading below.
In soft, sedimentary rocks, fault cores typically consist of non-cohesive smeared-out layers. In some cases, soft layers such as clay and silt may be smeared out to a continuous membrane which, if continuous in three dimensions, may greatly reduce the ability of fluids to cross the fault. In general, the thickness of the fault core shows a positive increase with fault throw, although variations are great even along a single fault within the same lithology. 
The damage zone is characterized by a density of brittle deformation structures that is higher than the background level. It envelops the fault core, which means that it is found in the tip zone as well as on each side of the core. Structures that are found in the damage zone include deformation bands, shear fractures, tensile fractures and stylolites, and Figure below shows an example of how such small-scale structures (deformation bands) only occur close to the fault core, in this case defining a footwall damage zone width of around 15 meters.
Damage zone in the footwall to a normal fault with 150–200 m throw. The footwall damage zone is characterized by a frequency diagram with data collected along the profile line. A fault lens is seen in the upper part of the fault. Entrada Sandstone near Moab, Utah.
The width of the damage zone can vary from layer to layer, but, as with the fault core, there is a positive correlation between fault displacement and damage zone thickness (Figure below a). Logarithmic diagrams such as shown in Figure below are widely used in fault analysis, and straight lines in such diagrams indicate a constant relation between the two plotted parameters. In particular, for data that plot along one of the straight lines in this figure, the ratio between fault displacement D and damage zone thickness DT is the same for any fault size, and the distance between adjacent lines in this figure represents one order of magnitude. Much of the data in Figure below a plot around or above the line D=DT, meaning that the fault displacement is close to or somewhat larger than the damage zone thickness, at least for faults with displacements up to 100 meters. We could use this diagram to estimate throw from damage zone width or vice versa, but the large spread of data (over two orders of magnitude) gives a highly significant uncertainty. 
A similar relationship exists between fault core thickness (CT) and fault displacement (Figure below b). This relationship is constrained by the straight lines D=1000CT and D-10CT, meaning that the fault core is statistically around 1/100 of the fault displacement for faults with displacements up to 100 meters.
(a) Damage zone thickness (DT) (one side of the fault) plotted against displacement (D) for faults in siliciclastic sedimentary rocks. (b) Similar plot for fault core thickness (CT). Note logarithmic axes. Data from several sources.
Layers are commonly deflected (folded) around faults, particularly in faulted sedimentary rocks. The classic term for this behavior is drag, which should be used as a purely descriptive or geometric term. The drag zone can be wider or narrower than the damage zone, and can be completely absent. The distinction between the damage zone and the drag zone is that drag is an expression of ductile fault-related strain, while the damage zone is by definition restricted to brittle deformation. They are both part of the total strain zone associated with faults. In general, soft rocks develop more drag than stiff rocks.

Fault rocks

When fault movements alter the original rock sufficiently it is turned into a brittle fault rock. There are several types of fault rocks, depending on lithology, confining pressure (depth), temperature, fluid pressure, kinematics etc. at the time of faulting. It is useful to distinguish between different types of fault rocks, and to separate them from mylonitic rocks formed in the plastic regime. Sibson (1977) suggested a classification based on his observation that brittle fault rocks are generally non-foliated, while mylonites are well foliated. He further made a distinction between cohesive and non-cohesive fault rocks. Further subclassification was done based on the relative amounts of large clasts and fine-grained matrix. Sibson’s classification is descriptive and works well if we also add that cataclastic fault rocks may show a foliation in some cases. Its relationship to microscopic deformation mechanism is also clear, since mylonites, which result from plastic deformation mechanisms, are clearly separated from cataclastic rocks in the lower part of the diagram. 

Fault breccia is an unconsolidated fault rock consisting of less than 30% matrix. If the matrix fragment ratio is higher, the rock is called a fault gouge. A fault gouge is thus a strongly ground down version of the original rock, but the term is sometimes also used for strongly reworked clay or shale in the core of faults in sedimentary sequences. These unconsolidated fault rocks form in the upper part of the brittle crust. They are conduits of fluid flow in non-porous rocks, but contribute to fault sealing in faulted porous rocks.
Pseudotachylyte consists of dark glass or microcrystalline, dense material. It forms by localized melting of the wall rock during frictional sliding. Pseudotachylyte can show injection veins into the sidewall, chilled margins, inclusions of the host rock and glass structures. It typically occurs as mm- to cm-wide zones that make sharp boundaries with the host rock. Pseudotachylytes form in the upper part of the crust, but can form at large crustal depths in dry parts of the lower crust. 

Crush breccias are characterised by their large fragments. They all have less than 10% matrix and are cohesive and hard rocks. The fragments are glued together by cement (typically quartz or calcite) and/or by microfragments of mineral that have been crushed during faulting.
Cataclasites are distinguished from crush breccias by their lower fragment–matrix ratio. The matrix consists of crushed and ground-down microfragments that form a cohesive and often flinty rock. It takes a certain temperature for the matrix to end up flinty, and most cataclasites are thought to form at 5km depth or more. 
Mylonites, which are not really fault rocks although loosely referred to as such by Sibson, are subdivided based on the amount of large, original grains and recrystallised matrix. Mylonites are well foliated and commonly also lineated and show abundant evidence of plastic deformation mechanisms rather than frictional sliding and grain crushing. They form at greater depths and temperatures than cataclasites and other fault rocks; above 300 C for quartz-rich rocks. The end-member of the mylonite series, blastomylonite, is a mylonite that has recrystallized after the deformation has ceased (postkinematic recrystallization). It therefore shows equant and strain-free grains of approximately equal size under the microscope, with the mylonitic foliation still preserved in hand samples.
Credits: Haakon Fossen (Structural Geology)

Sunday, June 11, 2017

Deformation bands and fractures in porous rocks

Deformation bands

Rocks respond to stress in the brittle regime by forming extension fractures and shear fractures (slip surfaces). Such fractures are sharp and mechanically weak discontinuities, and thus prone to reactivation during renewed stress build-up. At least this is how non-porous and low-porosity rocks respond. In highly porous rocks and sediments, brittle deformation is expressed by related, although different, deformation structures referred to as deformation bands.
Kinematic classification of deformation bands and their relationship to fractures in low-porosity and non-porous rocks. T, thickness; D, displacement.
Deformation bands are mm-thick zones of localised compaction, shear and/or dilation in deformed porous rocks. Figure above  shows how deformation bands kinematically relate to fractures in non-porous and low-porosity rocks, but there are good reasons why deformation bands should be distinguished from ordinary fractures. One is that they are thicker and at the same time exhibit smaller shear displacements than regular slip surfaces of comparable length (Figure (a) below). This has led to the term tabular discontinuities, as opposed to sharp discontinuities for fractures. Another is that, while cohesion is lost or reduced across regular fractures, most deformation bands maintain or even show increased cohesion. Furthermore, there is a strong tendency for deformation bands to represent low permeability tabular objects in otherwise highly permeable rocks. This permeability reduction is related to collapse of pore space, as seen in the band from Sinai portrayed in Figure (b) below. In contrast, most regular fractures increase permeability, particularly in low-permeability and impermeable rocks. This distinction is particularly important to petroleum geologists and hydrogeologists concerned with fluid flow in reservoir rocks. The strain hardening that occurs during the formation of many deformation bands also makes them different from fractures, which are associated with softening. 
(a) Cataclastic deformation band in porous Navajo Sandstone. The thickness of the band seems to vary with grain size, and the shear offset is less than 1 cm (the coin is 1.8 cm in diameter).
(b) Cataclastic deformation band in outcrop (left) and thin section (right) in the Nubian Sandstone, Sinai. Note the extensive crushing of grains and reduction of porosity (pore space is blue in the thin section). Width of bands 1 mm.
The difference between brittle fracturing of nonporous and porous rocks lies in the fact that porous rocks have a pore volume that can be utilised during grain reorganisation. The pore space allows for effective rolling and sliding of grains. Even if grains are crushed, grain fragments can be organised into nearby pore space.
The kinematic freedom associated with pore space allows the special class of structures called deformation bands to form.

What is a deformation band?

How do deformation bands differ from regular fractures in non-porous rocks? Here are some characteristics of deformation bands: 
  • Deformation bands are restricted to highly porous granular media, notably porous sandstone.
  • A shear deformation band is a wider zone of deformation than regular shear fractures of comparable displacement.
  • Deformation bands do not develop large offsets. Even 100 m long deformation bands seldom have offsets in excess of a few centimetres, while shear fractures of the same length tend to show meter-scale displacement. 
  • Deformation bands occur as single structures, as clusters, or in zones associated with slip surfaces (faulted deformation bands). This is related to the way that faults form in porous rocks by faulting of deformation band zones.

Types of deformation bands 

Similar to fractures, deformation bands can be classified in a kinematic framework, where shear (deformation)bands, dilation bands and compaction bands form the end members (1st Figure). It is also of interest to identify the mechanisms operative during the formation of deformation bands. Deformation mechanisms depend on internal and external conditions such as mineralogy, grain size, grain shape, grain sorting, cementation, porosity, state of stress etc., and different mechanisms produce bands with different petrophysical properties. Thus, a classification of deformation bands based on deformation processes is particularly useful if permeability and fluid flow is an issue. The most important mechanisms are:
  • Granular flow (grain boundary sliding and grain rotation) 
  • Cataclasis (grain fracturing) 
  • Phyllosilicate smearing 
  • Dissolution and cementation 
The different types of deformation bands, distinguished by dominant deformation mechanism.
Deformation bands are named after their characteristic deformation mechanism, as shown in Figure above.
Brittle deformation mechanisms. Granular flow is common during shallow deformation of porous rocks
and sediments, while cataclastic flow occurs during deformation of well-consolidated sedimentary rocks and non-porous rocks.
  
Disaggregation bands develop by shear-related disaggregation of grains by means of grain rolling, grain boundary sliding and breaking of grain bonding cements; the process that we called particulate or granular flow (Figure above a). Disaggregation bands are commonly found in sand and poorly consolidated sandstones and form the “faults” produced in most sandbox experiments. Disaggregation bands can be almost invisible in clean sandstones, but may be detected where they cross and offset laminae (Figure below). Their true offsets are typically a few centimeters and their thickness varies with grain size. Fine-grained sand(stones) develop up to 1 mm thick bands, whereas coarser-grained sand (stones) host single bands that may be at least 5 mm thick. 
Macroscopically, disaggregation bands are ductile shear zones where sand laminae can be traced continuously through the band. Most pure and well-sorted quartz-sand deposits are already compacted to the extent that the initial stage of shearing involves some dilation (dilation bands), although continued shear-related grain reorganization may reduce the porosity at a later point.
Right-dipping compaction bands overprinting left-dipping soft-sedimentary disaggregation bands (almost invisible). The sandstone is very porous except for thin layers, where compaction bands are absent. Hence, the compaction bands only formed in very high porosity sandstone. Thin section photo shows that the compaction is assisted by dissolution and some grain fracture. Navajo Sandstone, southern Utah.
Phyllosilicate bands (also called framework phyllosilicate bands) form in sand(stone) where the content of platy minerals exceeds about 10–15%. They can be considered as a special type of disaggregation band where platy
minerals promote grain sliding. Clay minerals tend to mix with other mineral grains in the band while coarser phyllosilicate grains align to form a local fabric within the bands due to shear-induced rotation. Phyllosilicate bands are easy to detect, as the aligned phyllosilicates give the band a distinct color or fabric that may be reminiscent of phyllosilicate-rich laminae in the host rock.
If the phyllosilicate content of the rock changes across bedding or lamina interfaces, a deformation band may change from an almost invisible disaggregation band to a phyllosilicate band. Where clay is the dominant platy mineral, the band is a fine-grained, low-porosity zone that can accumulate offsets that exceed the few centimeters exhibited by other types of deformation bands. This is related to the smearing effect of the platy minerals along phyllosilicate bands that apparentlycounteracts any strain hardening resulting from interlocking of grains. 
If the clay content of the host rock is high enough (more than 40%), the deformation band turns into a clay smear. Clay smears typically show striations and classify as slip surfaces rather than deformation bands. Examples of deformation bands turning into clay smears as they leave sandstone layers are common.
Cataclastic bands form where mechanical grain breaking is significant (Figure b). These are the classic deformation bands first described by Atilla Aydin from the Colorado Plateau in the western USA. He noted that many cataclastic bands consist of a central cataclastic core contained within a mantle of (usually) compacted or gently fractured grains. The core is most obvious and is characterized by grain size reduction, angular grains and significant pore space collapse (Figure b). The crushing of grains results in extensive grain interlocking, which promotes strain hardening. Strain hardening may explain the small shear displacements observed on cataclastic deformation bands (3–4 cm). Some cataclastic bands are pure compaction bands (Figure above), while most are shear bands with some compaction across them. 
Cataclastic bands occur most frequently in sandstones that have been deformed at depths of about 1.5–3 km, although evidence of cataclasis is also reported from deformation bands deformed at shallower depths. Comparison suggests that shallowly formed cataclastic deformation bands show less intensive cataclasis than those formed at 1.5–3 km depth. 
Cementation and dissolution of quartz and other minerals may occur preferentially in deformation bands where diagenetic minerals grow on the fresh surfaces formed during grain crushing and/or grain boundary sliding. Such preferential growth of quartz is generally seen in deformation bands in sandstones buried to more than 2–3 km depth (>90 C) and can occur long after the formation of the bands.

Influence on fluid flow 

Very dense cluster of cataclastic deformation bands in the Entrada Sandstone, Utah.
Deformation bands form a common constituent of porous oil, gas and water reservoirs, where they occur as single bands, cluster zones or in fault damage zones. Although they are unlikely to form seals that can hold significant hydrocarbon columns over geologic time, they can influence fluid flow in some cases. Their ability to do so depends on their internal permeability structure and thickness or frequency. Clearly, the zone of cataclastic deformation bands shown in Figure above will have a far greater influence on fluid flow than the single cataclastic band shown in Figure a or b at the top.
Cataclastic deformation bands show the most significant permeability reductions.
Deformation band permeability is governed by the deformation mechanisms operative during their formation, which again depends on a number of lithological and physical factors. In general, disaggregation bands show little porosity and permeability reduction, while phyllosilicate and, particularly, cataclastic bands show permeability reductions up to several orders of magnitude. Deformation bands are thin, so the number of deformation bands (their cumulative thickness) is important when their role in a petroleum reservoir is to be evaluated. 
Conjugate (simultaneous and oppositely dipping) sets of cataclastic deformation bands in sandstone. Note the positive relief of the deformation bands due to grain crushing and cementation. The bands fade away downward into the more fine-grained and less-sorted unit. Entrada Sandstone, Utah.
Also important are their continuity, variation in porosity/permeability and orientation. Many show significant variations in permeability along strike and dip due to variations in amount of cataclasis, compaction or phyllosilicate smearing. Deformation bands tend to define sets with preferred orientation (Figure above), for instance in damage zones, and this anisotropy can influence the fluid flow in a petroleum reservoir, for example during water injection. All of these factors make it difficult to evaluate the effect of deformation bands in reservoirs, and each reservoir must be evaluated individually according to local parameters such as time and depth of deformation, burial and cementation history, mineralogy, sedimentary facies and more.
The influence of deformation bands on petroleum or groundwater production depends on the permeability contrast, cumulative thickness, orientations, continuity and connectivity.

What type of structure forms, where and when? 

Given the various types of deformation bands and their different effects on fluid flow, it is important to understand the underlying conditions that control when and where they form. A number of factors are influential, including burial depth, tectonic environment (state of stress) and host rock properties, such as degree of lithification, mineralogy, grain size, sorting and grain shape. Some of these factors, particularly mineralogy, grain size, rounding, grain shape and sorting, are more or less constant for a given sedimentary rock layer. They may, however, vary from layer to layer, which is why rapid changes in deformation band development may be seen from one layer to the next. 
Other factors, such as porosity, permeability, confining pressure, stress state and cementation, are likely to change with time. The result may be that early deformation bands are different from those formed at later stages in the same porous rock layer, for example at deeper burial depths. Hence, the sequence of deformation structures in a given rock layer reflects the physical changes that the sediment has experienced throughout its history of burial, lithification and uplift. 
Different types of deformation bands form at different stages during burial. Extension fractures (Mode I fractures) are most likely to form during uplift. 
To illustrate a typical structural development of sedimentary rocks that go through burial and then uplift, we use the diagram and add characteristic structures (Figure above). The earliest forming deformation bands in sandstones are typically disaggregation bands or phyllosilicate bands. Such structures form at low confining pressures (shallow burial) when forces across grain contact surfaces are low and grain bindings are weak, and are therefore indicated at shallow levels in Figures above and figure at the end. Many early disaggregation bands are related to local, gravity-controlled deformation such as local shale diapirism, underlying salt movement, gravitational sliding and glaciotectonics. 
Cataclastic deformation bands can occur in poorly lithified layers of pure sand at shallow burial depths, but are much more common in sandstones deformed at 1–3 km depth. Factors promoting shallow-burial cataclasis include small grain contact areas, i.e. good sorting and well-rounded grains, the presence of feldspar or
other non-platy minerals with cleavage and lower hardness than quartz, and weak lithic fragments. Quartz, for instance, seldom develops transgranular fractures under low confining pressure, but may fracture by flaking or spalling. At deeper depths, extensive cataclasis is promoted by high grain contact stresses. Abundant examples of cataclastic deformation bands are found in the Jurassic sandstones of the Colorado Plateau, where the age relation between early disaggregation bands and later cataclastic bands is very consistent (Figure above).
When a sandstone becomes cohesive and loses porosity during lithification (left side of Figure above), deformation occurs by crack propagation instead of pore space collapse, and slip surfaces, joints and mineral-filled fractures form directly without any precursory formation of deformation bands. This is why late, overprinting structures are almost invariably slip surfaces, joints and mineral-filled fractures. Slip surfaces can also form by faulting of low-porosity deformation band zones at any burial depth. 
Joints and veins typically postdate both disaggregation bands and cataclastic bands in sandstones. The transition from deformation banding to jointing may occur as porosity is reduced, notably through quartz dissolution and precipitation. Since the effect of such diagenetically controlled strengthening may vary locally, deformation bands and joints may develop simultaneously in different parts of a sandstone layer, but the general pattern is deformation bands first, then faulted deformation bands (slip surface formation) and finally joints (tensile fractures in Figure above) and perhaps faulted joints. 
The latest fractures in uplifted sandstones tend to form extensive and regionally mappable joint sets generated or at least influenced by removal of overburden and cooling during regional uplift. Such joints are pronounced where sandstones have been uplifted and exposed, such as on the Colorado Plateau, but are unlikely to be developed in subsurface petroleum reservoirs unexposed to significant uplift. It therefore appears that knowing the burial/uplift history of a basin in relation to the timing of deformation events is very useful when considering the type of structures present in, say, a sandstone reservoir. Conversely, examination of the type of deformation structure present also gives information about deformation depth and other conditions at the time of deformation.
Tentative illustration of how different deformation band types relate to phyllosilicate content and depth. Many other factors influence the boundaries outlined in this diagram, and the boundaries should be considered as uncertain.
Credits: Haakon Fossen (Structural Geology)